ANY: Music System ◦ Score ◦ Voice ◦ Instrument Or Theory Tool Config ◦
World Music's DIVERSITY and Data Visualisation's EXPRESSIVE POWER collide. A galaxy of INTERACTIVE, SCORE-DRIVEN instrument model and theory tool animations is born.
Entirely Graphical Toolset Supporting World Music Teaching & Learning Via Video Chat ◦ Paradigm Change ◦ Music Visualization Greenfield ◦ Crowd Funding In Ramp-Up ◦ Please Share
"The purpose of visualization is insight, not pictures". Ben Shneiderman
Nevertheless, for many, music visualisation (or visualization) is limited to colorful, swirling but largely cosmetic patterns derived from spectral values (loudness and frequency) typically to be found in audio or midi music files. This is indeed the focus of the current Wikipedia definition. Is it sufficient?
The Wikipedia article's naming problem stems from the misuse of the title 'Music visualization' in the first place. The general goal of spectral-value-generated imagery as described is not 'visualization' (in the sense of modeling), but in many cases deliberately abstract and algorithmically generated (originally 'electronic') art, as still explored in many art colleges..
Though not contesting their artistic merits (which I'm completely unqualified to judge) the claim to a "high degree of visual correlation" is, given algorithmic complexity and interworking, in all but the sense of synchronized 'activity', often tenuous.
David McCandless, author the widely acclaimed book "Information is Beautiful", defines successful visualization in terms of data (information), story (concept), goal (function) and visual form (metaphor). Music visualization is to my mind entirely analogous, if based on purely musical data.
Though there is clearly slight overlap (data can be derived from spectral information), spectral and music data visualizations are fundamentally different in their application.
The former generally results in decorative works with low information content (natural grouping 'arts and entertainment'), the latter in graphical models with high information content (with natural affinity to 'culture and education').
Only the latter embodies the notion of modeling music structure. As such, it is a decidedly more useful, potent and far-reaching application area - the visualization of physical and theoretical models in all their diversity. To these belong interactive, score-driven instrument models and of course music theory - both vast areas of study.
Music-data-driven Music visualization is the literal visualization of core musical structures under the impact of data drawn from a musical timeline. It is to specifically musical data as data visualization is to more generic notions of data.
In this sense, music visualization is a branch of (or applied) data visualization.
Music visualization as it currently stands in Wikipedia is a misnomer. Academic rigor demands it be corrected, but it is so longstanding as to have passed (albeit fleetingly) into common usage. The only way to deal with this is to qualify, to disambiguate it. Anything else (and especially a merger) will mix:
a topic with limited need for data quality with one absolutely dependent it
a result open to interpretation with one of very specific interpretation
a topic of largely entertainment value with one with determinedly educational value
Despite it's potential for driving global understanding, exchange and social value creation, world music (instrument and theory) visualization as a single, uniting discipline based on music data is more or less unexplored. Moreover, much of the existing, cosmetic works are tied to a particular operating system. What you might call applied and cloud or web-based music visualization is largely unexplored. It is, however, the gateway to truly immersive online and remote music learning.
Big, brave, open-source, non-profit, community-provisioned, cross-cultural and wax-a-chuckie crazy. → Like, share, back-link, pin, tweet and mail. Hashtags? For the crowdfunding: #VisualFutureOfMusic. For the future live platform: #WorldMusicInstrumentsAndTheory. Or simply register as a potential crowdfunder..
Each learner has his or her own learning preferences: the means by which musical understanding and ability is developed. Some prefer to learn by ear, progressively picking up all the tension and detail as the tempo is increased, some from the written note, others using tablature, some directly by mimicry from an instrument display, or indeed face to face from a more experienced player. Advanced players may opt for improvization in a simulated group or orchestra context.
Whatever the mode, studies show that the same brain centres are stimulated by both mental practice and actual physical movement. In other words, because the brain stores the information the same way, conscious visualization is as valuable as actual performance. Indeed, newcomers to music learning actively seek visual patterns.
Regardless of learning mode, this is something to be actively explored, yet fully source-driven, dynamic, interactive instrument and theory tool visualizations remain a rarity.
Judging by Google Search, however, music visualization can and does go beyond the purely cosmetic: from static interpretive artwork, through design of alternative music notations, to real-time music industry commercial visualizations, standalone and very specific theory animations, visualizations of the impact of music on the functioning of the brain, the on-screen simulation of stage or studio hardware, to the perceived visual relationships between mathematics, music and cosmos.
How much of this is relevant to or effective in musical learning is a matter of debate. Keeping in mind our overall goal of generating social (as opposed to purely commercial) value, let's survey the field of engagement..
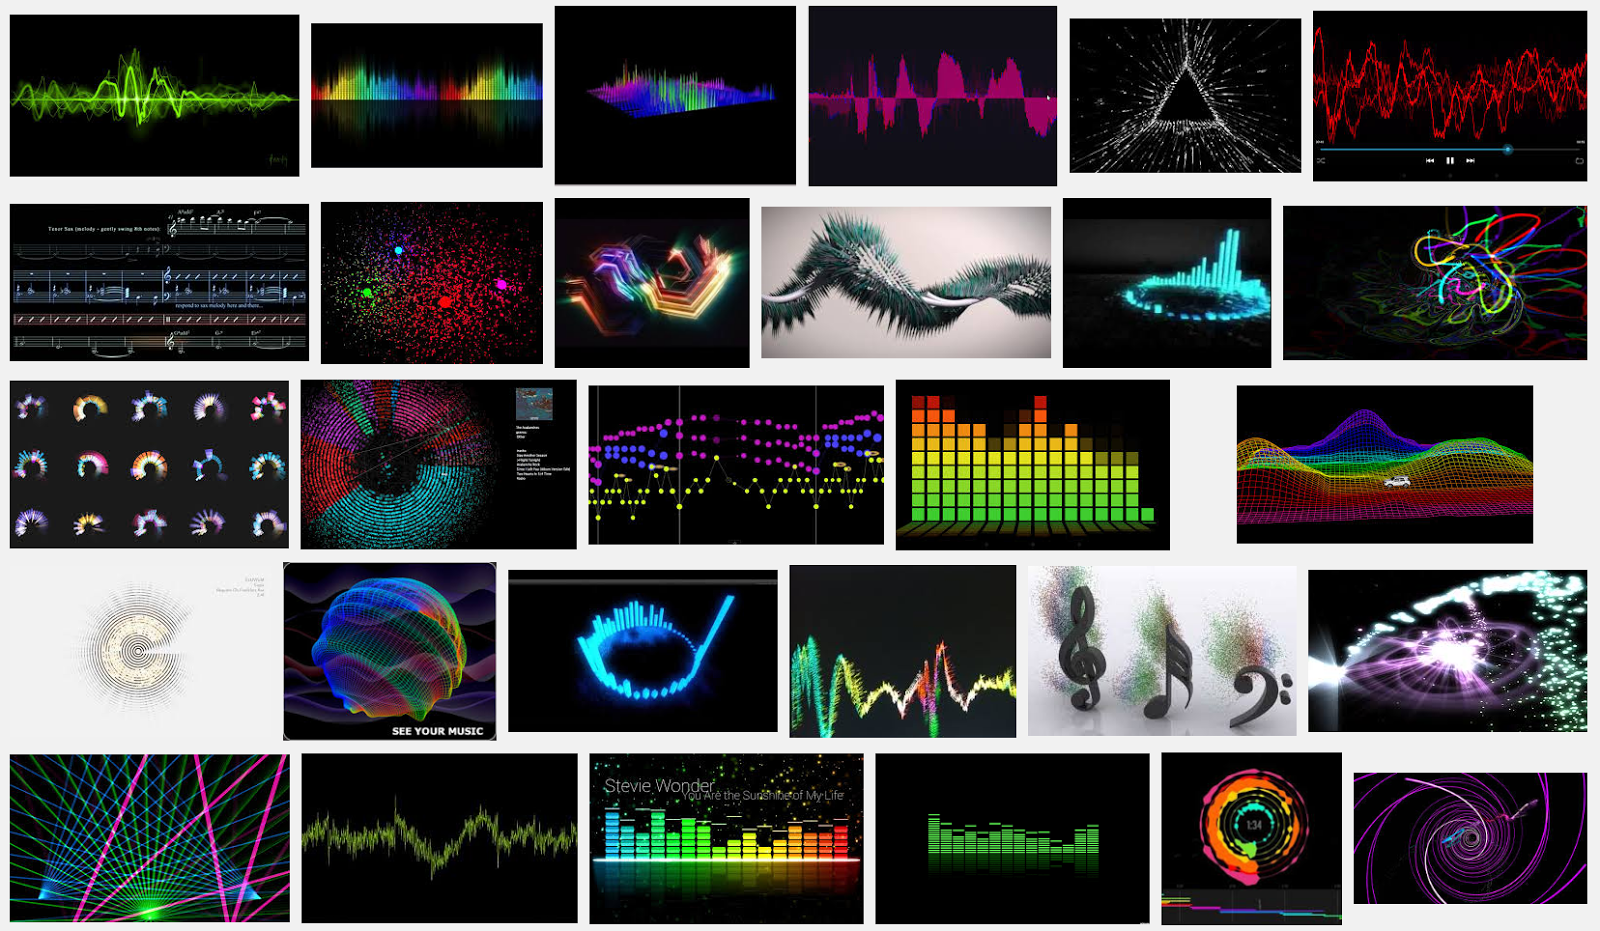
At the simplest level (with little or no information content), we have audio-driven graphics animations with focus on visual expression.
Not, however, necessarily trivial to create. Some rely on complex algorithms to achieve real-time 3D animation.
Cosmetic Music Visualizations
Ramped up a dimension.. LOTS of animation, but still no information.. Here we are in the realm of added, cosmetic visuals for event atmosphere.
Light Shows
So far, though, apart from sampling of sound level and/or frequencies, no attempt at deriving or mapping deeper musical data such as note or tone names, octave or even identification of the underlying music system.
While in the realm of social-commercial eye candy, here a playback / visualization interface the 'Reactable', a project from the Music Technology Group at the Universitat Pompeu Fabra in Barcelona:
Industry Insights
Radically tangential are the standard business presentations reflecting industry trends. Derived from industry data using off-the-shelf visualization packages, the stuff of suits. Essentially a little bland.
Music Industry Insights
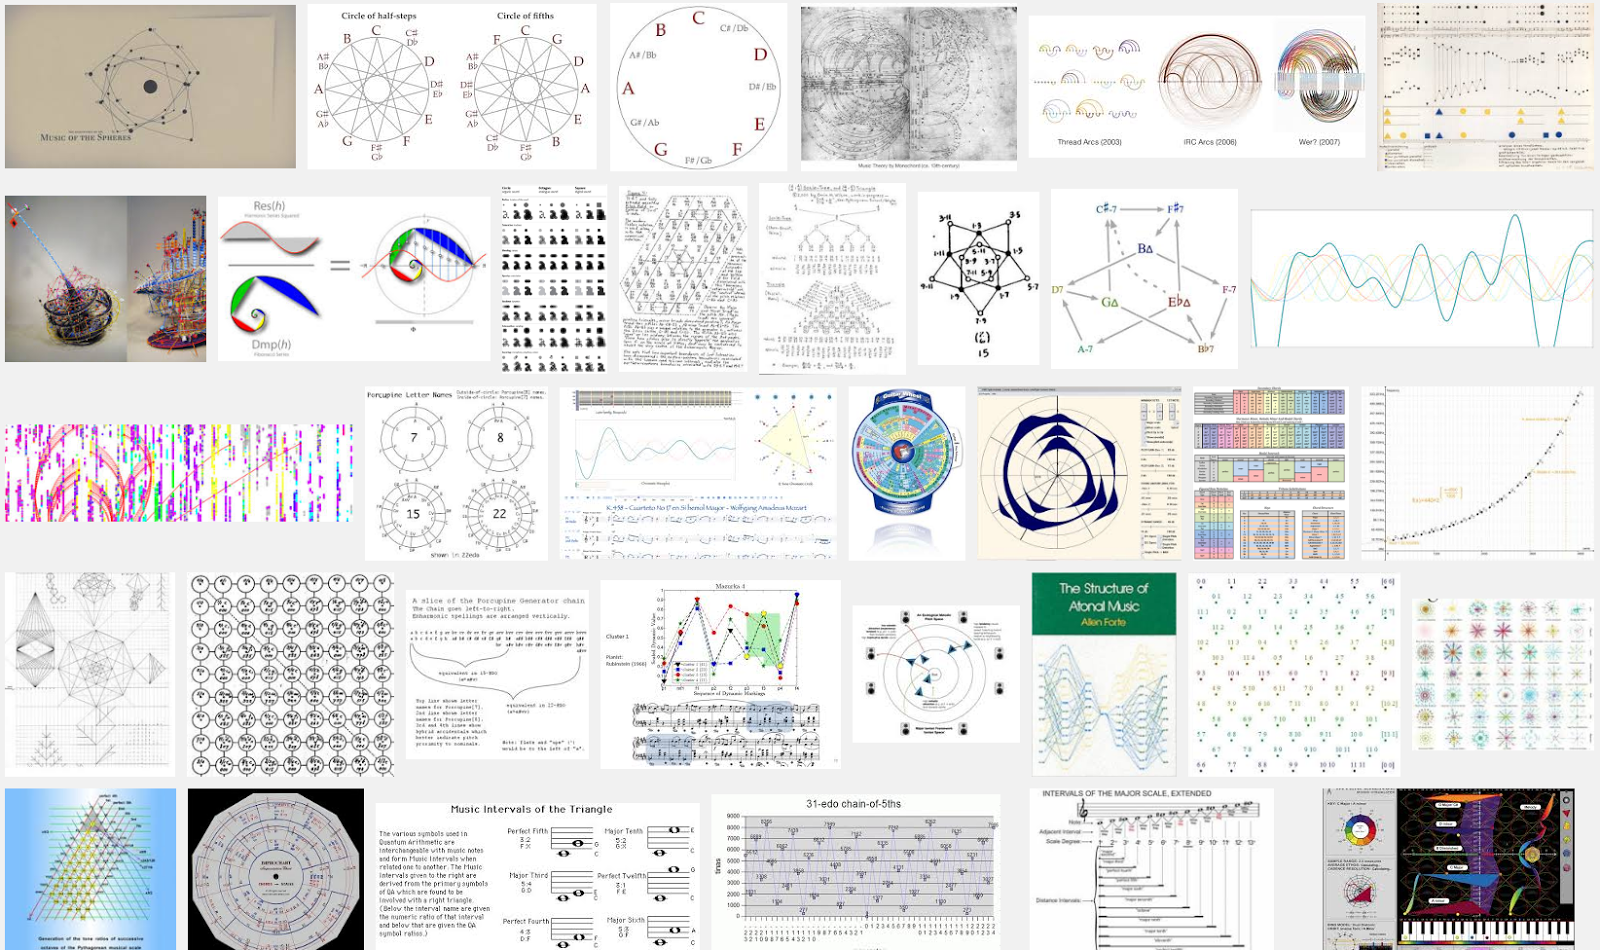
Music Theory Visualization
Huge cache of these on the internet, but perhaps also the first real surprise: hardly any animation. Information-rich, pretty, but predominantly static images.
Music Theory Visualizations
Even where animated, such tools are pretty much universally divorced from the musical score, their 'context'.
Associating the two is left to the user - a mental effort few are likely to undertake, and calling the real value to the end user into question.
Here (for example) an introduction to a popular standalone circle of fifths app, with (conspicuously) no context.
It's a similar story for the most recent chord-finder applications, even where AI assisted.
Music Sequencers
In the browser? Yup. A few. Visualisation? Only of the bits that go bang if dropped..
Software Sequencers
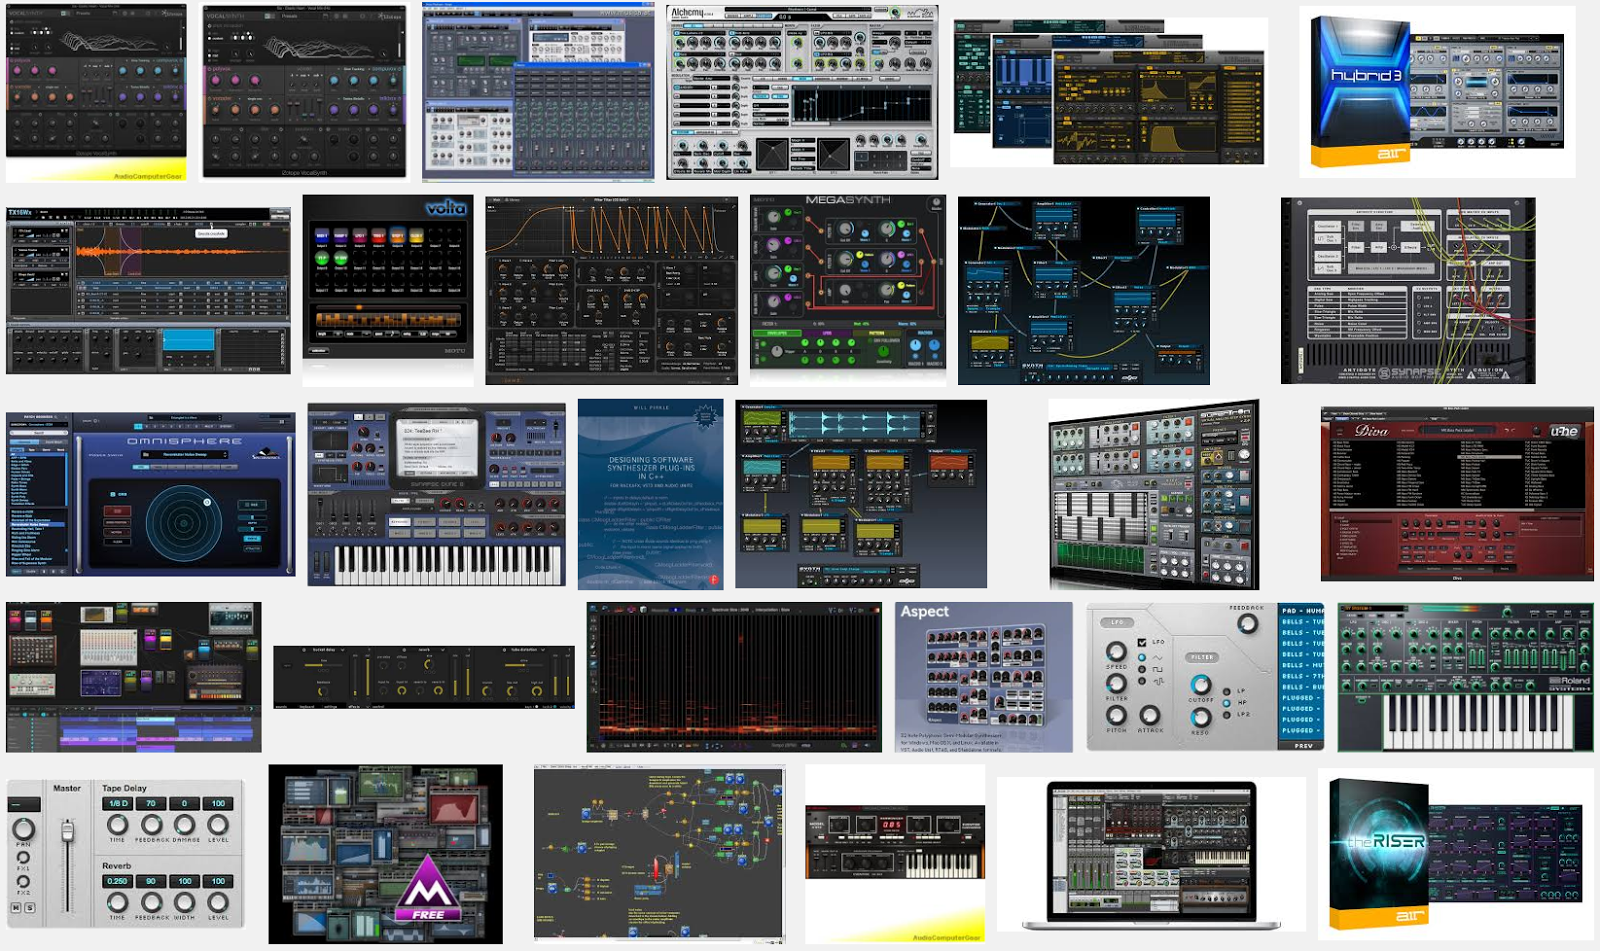
Synthesizers
In the browser? Yup. A few. Visualizations on a conceptual / engineering level only..
Software Synthesizers
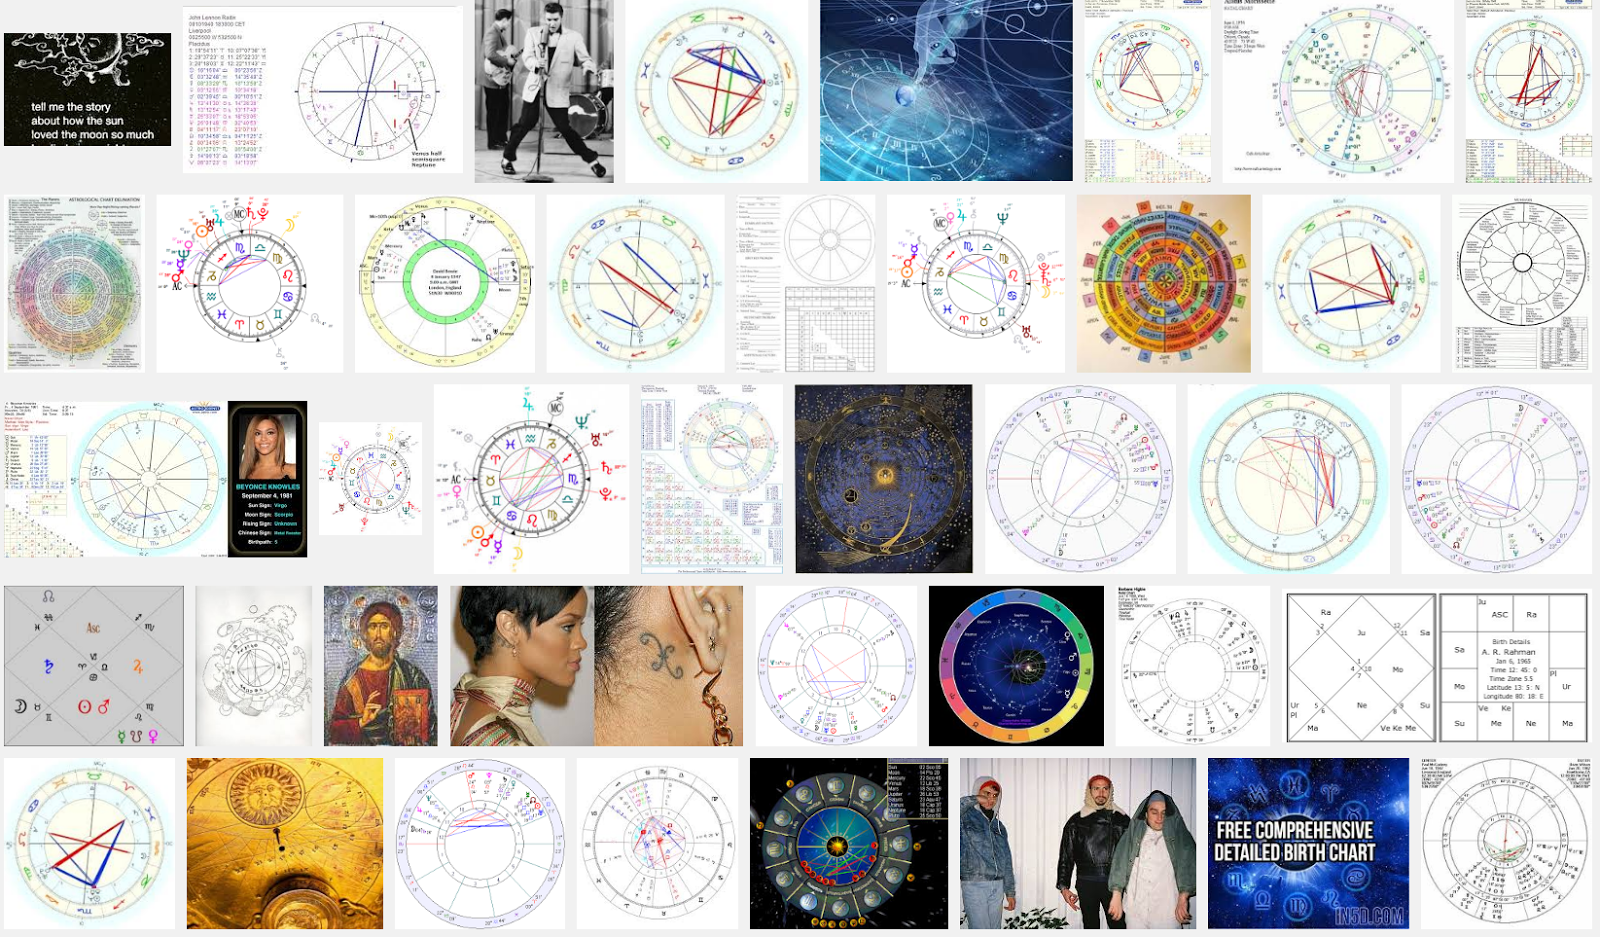
State of Mind
Music and wish or ideal? Of course.. Retro, for example..
Even if we venture into the at times obsessive mathematical landscapes of music esoterica enthusiast, all is static. In compensation, colourful!
Music Esoterica Visualizations
Music and (Pure) Mathematics
Presumably a little more money behind these. Some dynamic elements creeping in..
Music and Mathematics
The Physics Of Music
Though slowly taking off, this area is badly hamstrung by the inability to access musical data (the goal of our music visualization aggregator platform). Nevertheless, instructional videos on topics such as timbre, tone colour or the waveform properties are beginning to appear. While not in themselves direct visualizations, they can provide information of use to us in basic instrument and physical modeling.
Online university-level music courses go into considerably more detail.
Not all music visualizations need necessarily be custom built. Many useful representations can be built with more or less standard, or 'off-the-shelf' animations.
In many cases these can be more or less chosen from a prepackaged library, with the data populated from (generally JSON format) file.
There are, however, many liberally-licensed example files around which can be extended for own use. Generally you need only look for the name of the underlying visualization library (such as 'd3.js'), along with the term 'gallery'.
As illustrated here, there are also a wide range of icons representing these visualizations.
"Off the shelf" visualizations have wide application in instrument modeling, theory tool creation and (above all) supporting visualizations.
To the latter belong those representing relationships between various community groupings, calendar and scheduling functions, hierarchies and workflows.
In effect, lots of potential.
Music Apps
Never assume you know more than your kids. They have it good - if simple.
Music Apps
Seriously Good Software
Ok, we all know search engine limitations. How's about YouTube and the grapevine? Interactive, solidly useful - but forget visualization. Here some picks.
As tabs are introduced for other instruments, Soundslice is likely to grow. Rather dramatically.
This must seriously frustrate at least one developer, whose Guitar Tab Player was around far earlier..
Mathemusic4D
This may not have been implemented in the browser using SVG, but in combining a base lattice or tonnetz structure with animation, this is the kind of rabbit we want to be chasing.
Perhaps a graphing library built on D3.js for the hexagonal tonnetz, and WebGL (three.js?) for the gyroscopic 4D thingy on the right.
Mapping Tonal Harmony Pro
Another novel visual approach, this time splitting the circle of fifths into tonal regions then used to lay bare potential improvization paths.
This example comprises a nice explanation, model and tool, reinforcing the conviction that there may be many possible models or views to a given theory topic.
In the end, however, these model's final destination are the regions of the brain responsible for visual processing. Here an intriguing glimpse into just one of the possibilities unfolding.
Another branch of music visualization is that represented by augmented and virtual reality. There seems to my mind to be something of a disconnect between the physics of playing a real instrument and the somewhat contrived handling of the paddles in the following video.
It takes no great leap of imagination to see this scenario enhanced by virtuoso-led teaching, but I'm still left wondering what would happen to someone training on entirely virtual instruments when they are confronted with the real thing. Something for a Youtube spoof.. :-)
Finish
So there you have it. State of the Art / Where We Start. If data visualization's role in data science ("communcate, visualise, report" below) is well understood, where does that leave music visualization?
By analogy, we are talking of the full-blown visualization of every aspect of music - it's structures, patterns, evolution, instrumentation, culture, genres and values, but -insofar as it has a temporal dimension and is linked to music- a wider ecosystem of events, storytelling, animated art and esoterics.
At it's most abstract, however, this is reduced to just two elements: Music Plus Data Visualization Equals Music Visualization The project in focus here simply aggregates the results into a single platform.
"Literal" Music Visualization
At a high level I see it as the foundation for music learning workflows based on progressively more insightful animations, under the guidance of a genre-knowledgeable, remote (P2P-connected) mentor or tutor.
At another level, I see it as an opportunity for much needed / just-in-time social value creation prior to the singularity.
Overlaid with a remote, P2P teaching capability, this has the potential for driving musical diversity, and for the dirtiest of reasons: the process of learning from others 1:1 is replete with interpretational noise, and hence subtle change. This is the very lifeblood of musical evolution.
To close, I draw your attention to the characteristics of a good data visualization as formulated by David McCandless, a leading visualization practitioner. The diagram seems to me as valid for music- as data- visualization.
Music visualization is a journey which has barely begun. It is perhaps the storytelling and metaphor areas which open up the most intriguing possibilities.
Music Visualization: Exploit the Platform, Free The Mind
The world music visualization aggregator platform will free us of the hassle of manipulating raw data, allowing us to concentrate on our storytelling goals and chosen metaphors. Exploit the platform. Free the mind.
Keywords
online music learning,
online music lessons
distance music learning,
distance music lessons
remote music lessons,
remote music learning
p2p music lessons,
p2p music learning
music visualisation
music visualization
musical instrument models
interactive music instrument models


Comments, questions and (especially) critique welcome.