There are several possible types of music visualisation. We take a closer look.
Big, brave, open-source, non-profit, community-provisioned, cross-cultural and bow-wow crazy. → Like, share, back-link, pin, tweet and mail. Hashtags? For the crowdfunding: #VisualFutureOfMusic. For the future live platform: #WorldMusicInstrumentsAndTheory. Or simply register as a potential crowdfunder..
Music Visualisation Types
Note: the images in this post are drawn from external sites which you are encouraged to visit for further information.
Setting aside the purely aesthetic or cosmetic (no information content), what other visualisation types can we identify?
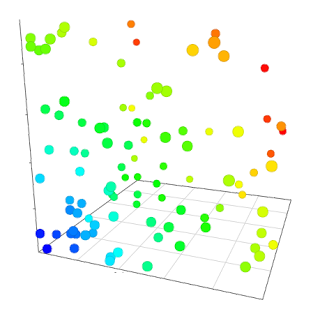 |
| 3D Scatterplot |
Static
 Static visualisations are the ones we are accustomed to in infographics, books and many images in the internet: fixed for all time. Taken in raw numbers, these represent the largest potential for animation, most of which can be broken down into a small range of standard visual forms.
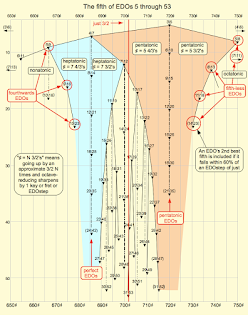
There are exceptions. The Stern-Brocot tree, which approximates rational numbers by fractions using a binary search between two bounds until the desired precision is found, helps us visually correlate our perception of consonance / dissonance of musical harmonies with their periodicity.
It represents something of a challenge in that it does not correspond to one of the more recognisable music-geometrical forms, such as circle, spiral, cone, tonnetz or torus.
Active
Limited animation (GIF or video). Here, a short series of images are exchanged in sequence, giving the appearance of animation.
Though neither addressable, modifiable, interactive nor necessarily informative, they can be quite mesmerising. :-)
Interactive
By interactive, we can understand a standalone animation, with user controls allowing simple interaction, but devoid of any driver protocol such as MusicXML, Midi or audio.
While interesting in themselves, they are short on context (audio, or musical score), and hence immediacy and immersion.
Timeline-Interactive
Here we go that proverbial extra mile, driving what may well in itself be an interactive animation using information embedded in a timeline (so-called 'time series'). Even here we can distinguish two subcategories.
In the following example, the user is the driver. Selections on the timeline below the map affect both what is displayed, and where. You will need to follow the link in the caption text to try this out.
Music Protocol as Animation Driver
While there are many timeline-based datasets and protocols around, our specific interest is in those supporting notation, audio sonogram or tablature display and in themselves acting as driver for associated animations.
The animations of most interest will
- protocol driven (immediate, dynamic)
- sufficient and informative
- interactive
- intuitive to navigate and understand
Labels excepted, I envisage the interface remaining entirely graphical, explanations left to the teacher (or provided by links to reference sites such as Wikipedia), and that it be de-cluttered during use (for example that menus appear only when a gesture or pointer action is made near the display edges).
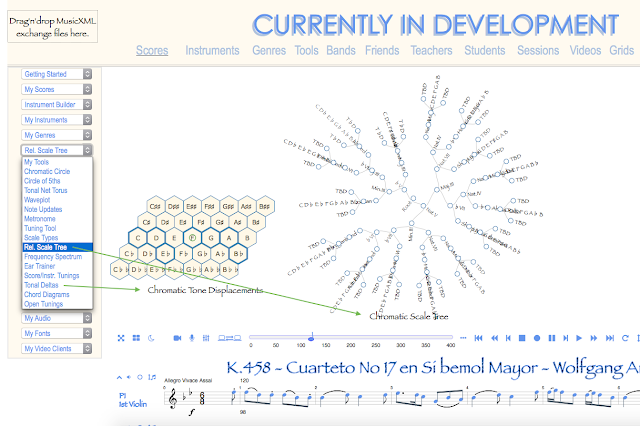 |
| Music Visualisation Aggregator Platform or Framework: Currently in Development. |
Suitable driving protocols include MusicXML, Midi or audio. Some further timeline-animated examples from other domains?:
 |
| TimeViz: A Visual Survey of Visualization Techniques for Time-Oriented Data |
Data Visualisation Technology
Many of the currently most successful visualisation libraries build on the browser's inherent characteristics and qualities, in some cases acting as an abstraction layer, removing some concerns about hardware or browser version compatibility.
Moreover, they adhere to the 'build once, run anywhere' school of thought: considerably cheaper than developing dedicated apps for each of four or five mobile operating systems.
The technologies at the heart of this ecosystem are html5, the browser's domain object model (DOM), javascript and scalar vector graphics (SVG).
Given these and advanced modelling libraries such as D3.js (for 2D visualisation) and three.js (3D), a wide range of visualisation possibilities are opened.
 |
| ThreeAudio.js exposes audio data in GLSL shaders for use with Three.js |
This area has been -in a musical context- poorly explored. (Central to this was the lack of a lightweight, truly data-driven and data-visualised score presentation). The most important building blocks are now in place: the next step is their industrialisation in the sense of being made publicly available in an aggregator platform.
Dynamics, Immersion, Interworking and Immediacy
Even in the context of single user, there are significant challenges. These begin with achieving comprehensively data-driven and selectable/interrogable notation, continues with it's synchronisation of all dependent animations, followed by synchronisation with the play of a live teacher. Common to all these, is comprehensive configuration freedom - with instantaneous fulfilment.
'On-demand' is not 'immediate-need-driven', and 'synchronised' not necessarily 'real-time'. The central challenge of the hour is to ensure that all media (visualisations, video, audio etc) are totally integrated, and are synchronised with, and under the control of, a live teacher. This notion is tentatively summarised in the following diagram.
Many music learners still work with PDFs, text files, score images or standalone audio or video. These are out of place in an on-demand, near-real-time and 'immediate need' culture.
These concepts are in principle brought together in the above diagram. Each hanging branch represents how various types of media might be used to solve a specific task, need or problem. Lower hanging fruit (technologies that tend to lack interactivity and so impede things like synchronisation, control or integration) can be expected to be succeeded by higher level ones. Towards the top of the diagram these tend to converge towards a totally integrated, real-time and wholly configurable solution.
The higher up this tree, the better the immediacy and immersion. Higher-level integration of this type allows us to model, onscreen, almost any world music notation, instrument, or theory tool -and to match, compare and exchange them at will and in any configuration.
Moreover, it allows us to draw all the threads together into one end-to-end toolset and workflow - and not just for western 12-tone equal temperament, but for all world music systems.
A peer-to-peer system built on these principles greatly simplifies one-way synchronisation - which, if not allowing simultaneous play, is certainly enough to teach. Help us get there.
From this point on, the only limit is imagination. This journey has hardly begun.
Keywords
online music learning,
online music lessons
|
distance music learning,
distance music lessons
|
remote music lessons,
remote music learning
|
p2p music lessons,
p2p music learning
|
music visualisation
music visualization
|
musical instrument models
interactive music instrument models
|
music theory tools
musical theory
|
p2p music interworking
p2p musical interworking
|
comparative musicology
ethnomusicology
|
world music
international music |
folk music
traditional music
|
P2P musical interworking,
Peer-to-peer musical interworking
|
WebGL, Web3D,
WebVR, WebAR
|
Virtual Reality,
Augmented or Mixed Reality
|
Artificial Intelligence,
Machine Learning
|
Scalar Vector Graphics,
SVG
|
3D Cascading Style Sheets,
CSS3D
|
X3Dom,
XML3D
|
 Static visualisations are the ones we are accustomed to in infographics, books and many images in the internet: fixed for all time. Taken in raw numbers, these represent the largest potential for animation, most of which can be broken down into a small range of standard visual forms.


Comments, questions and (especially) critique welcome.